
Every currency is losing value. Here’s the proof.
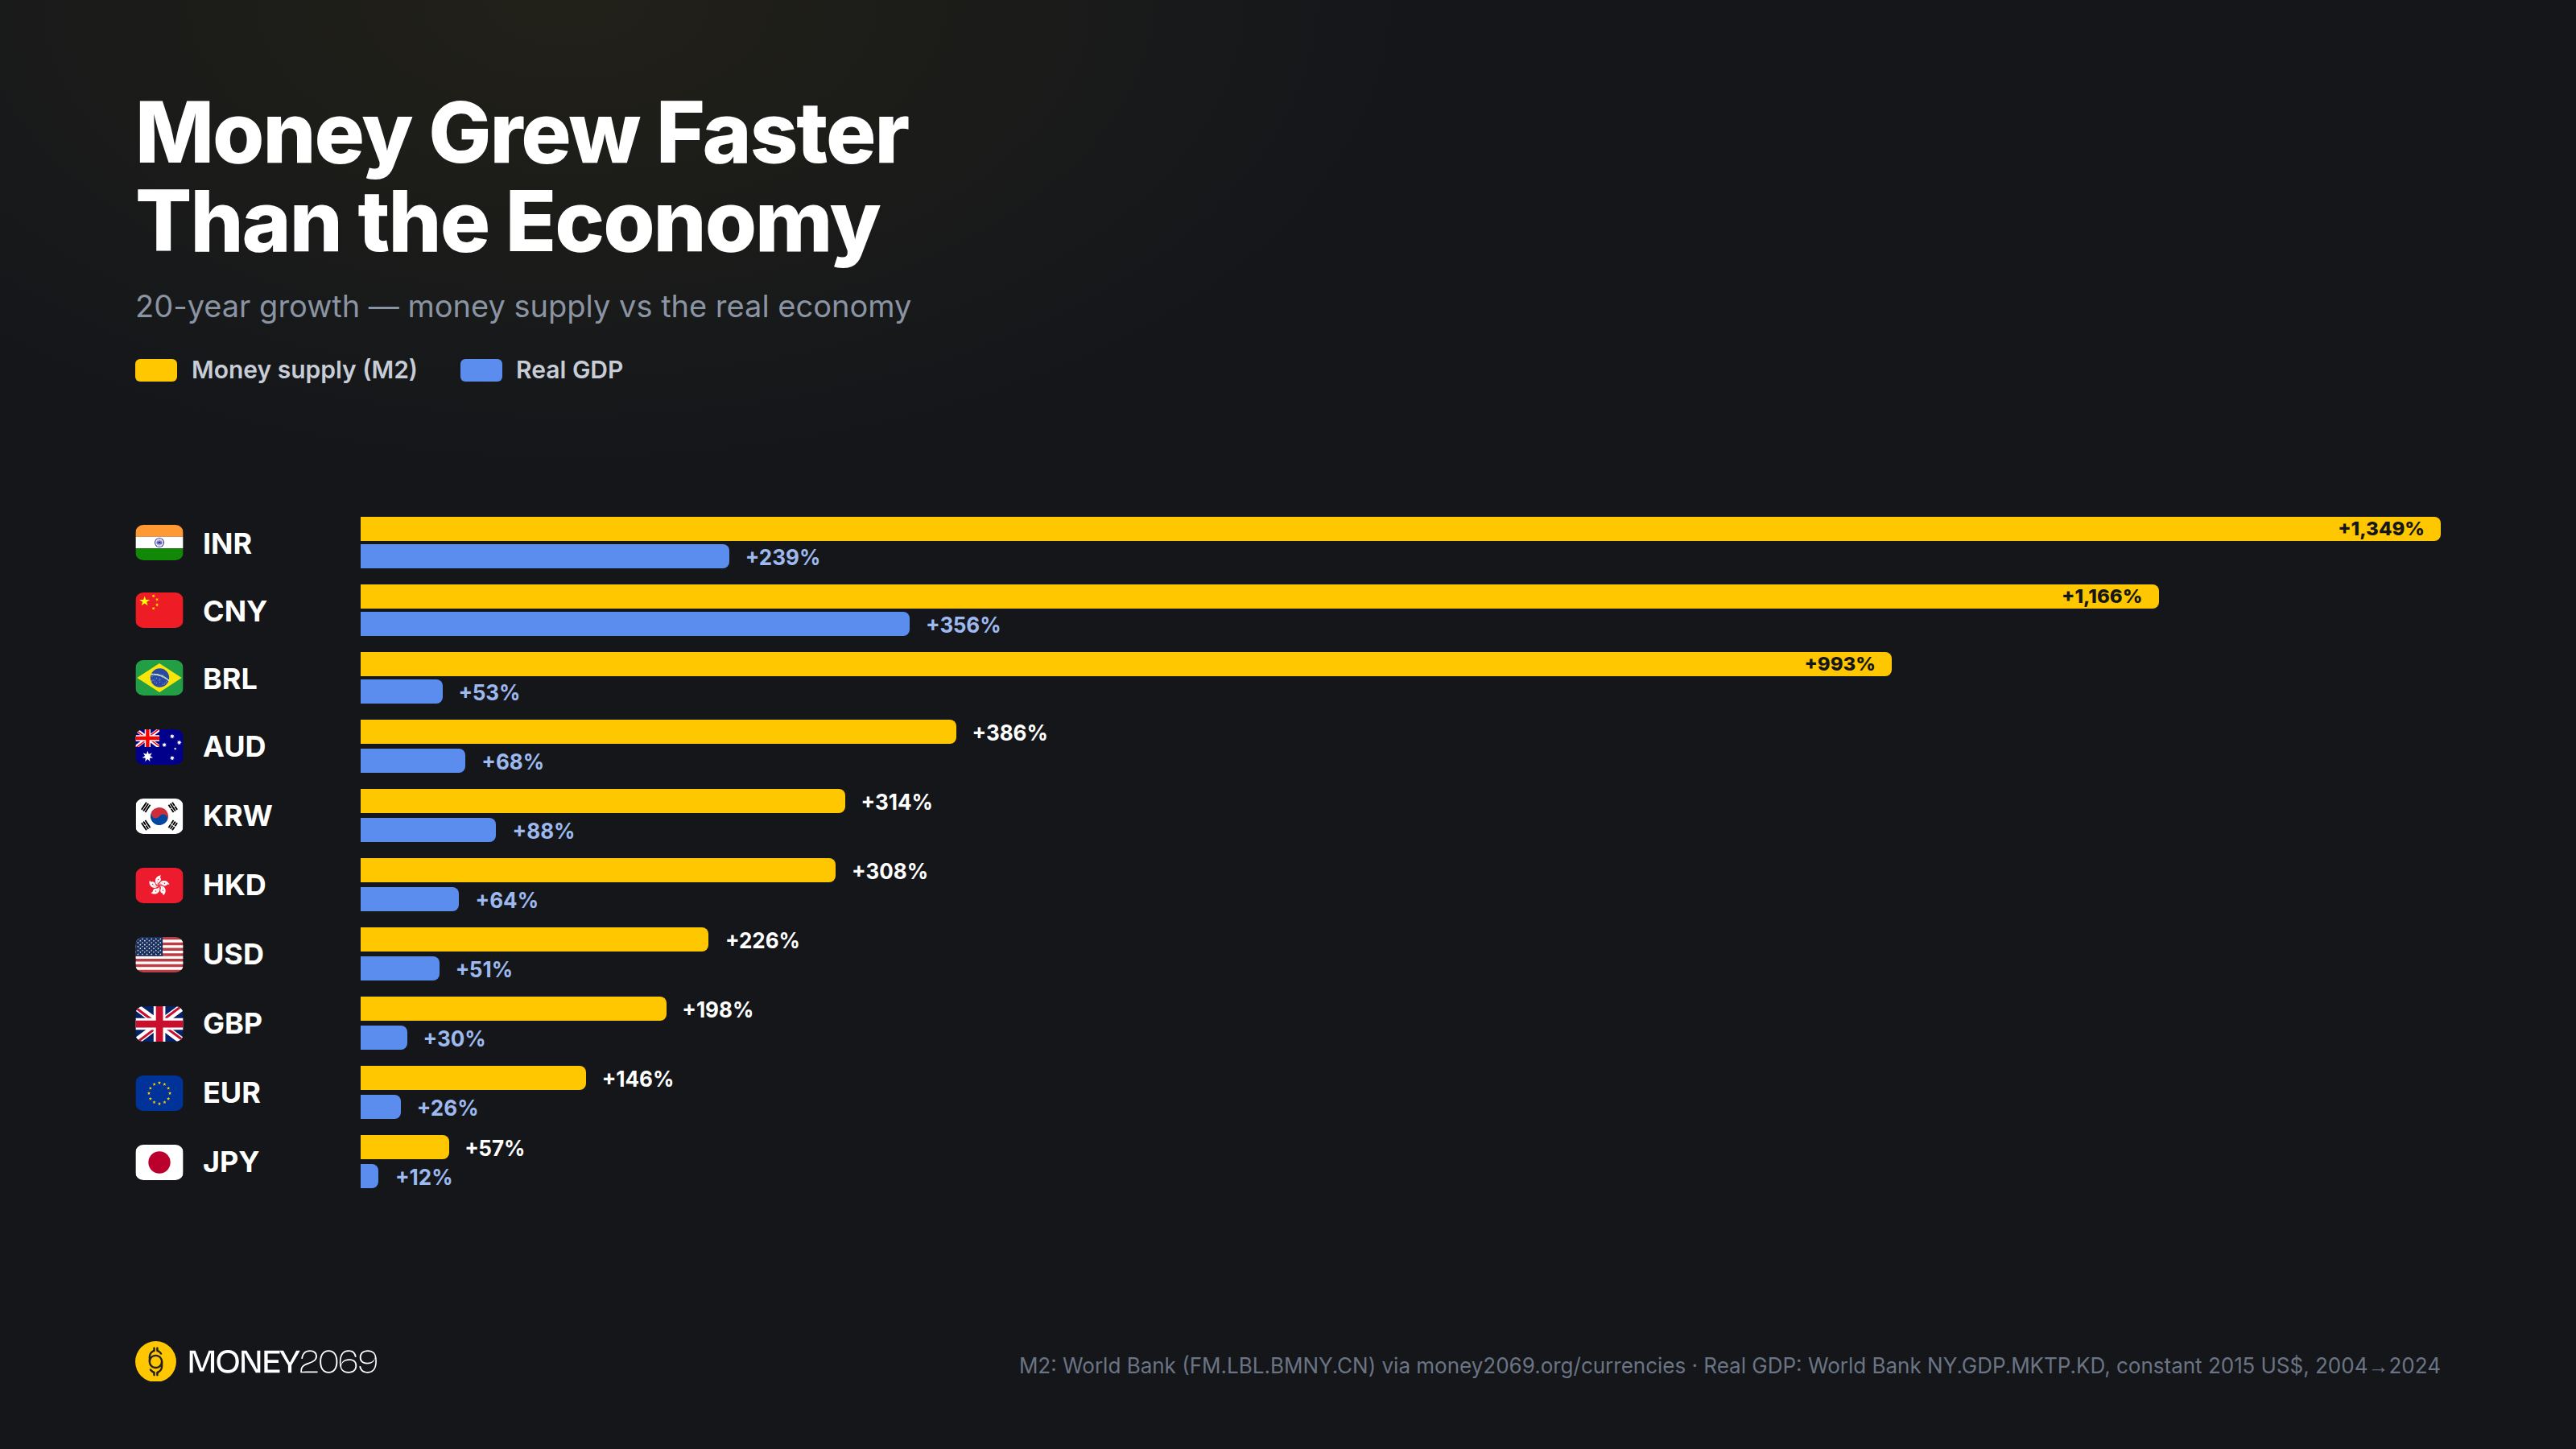
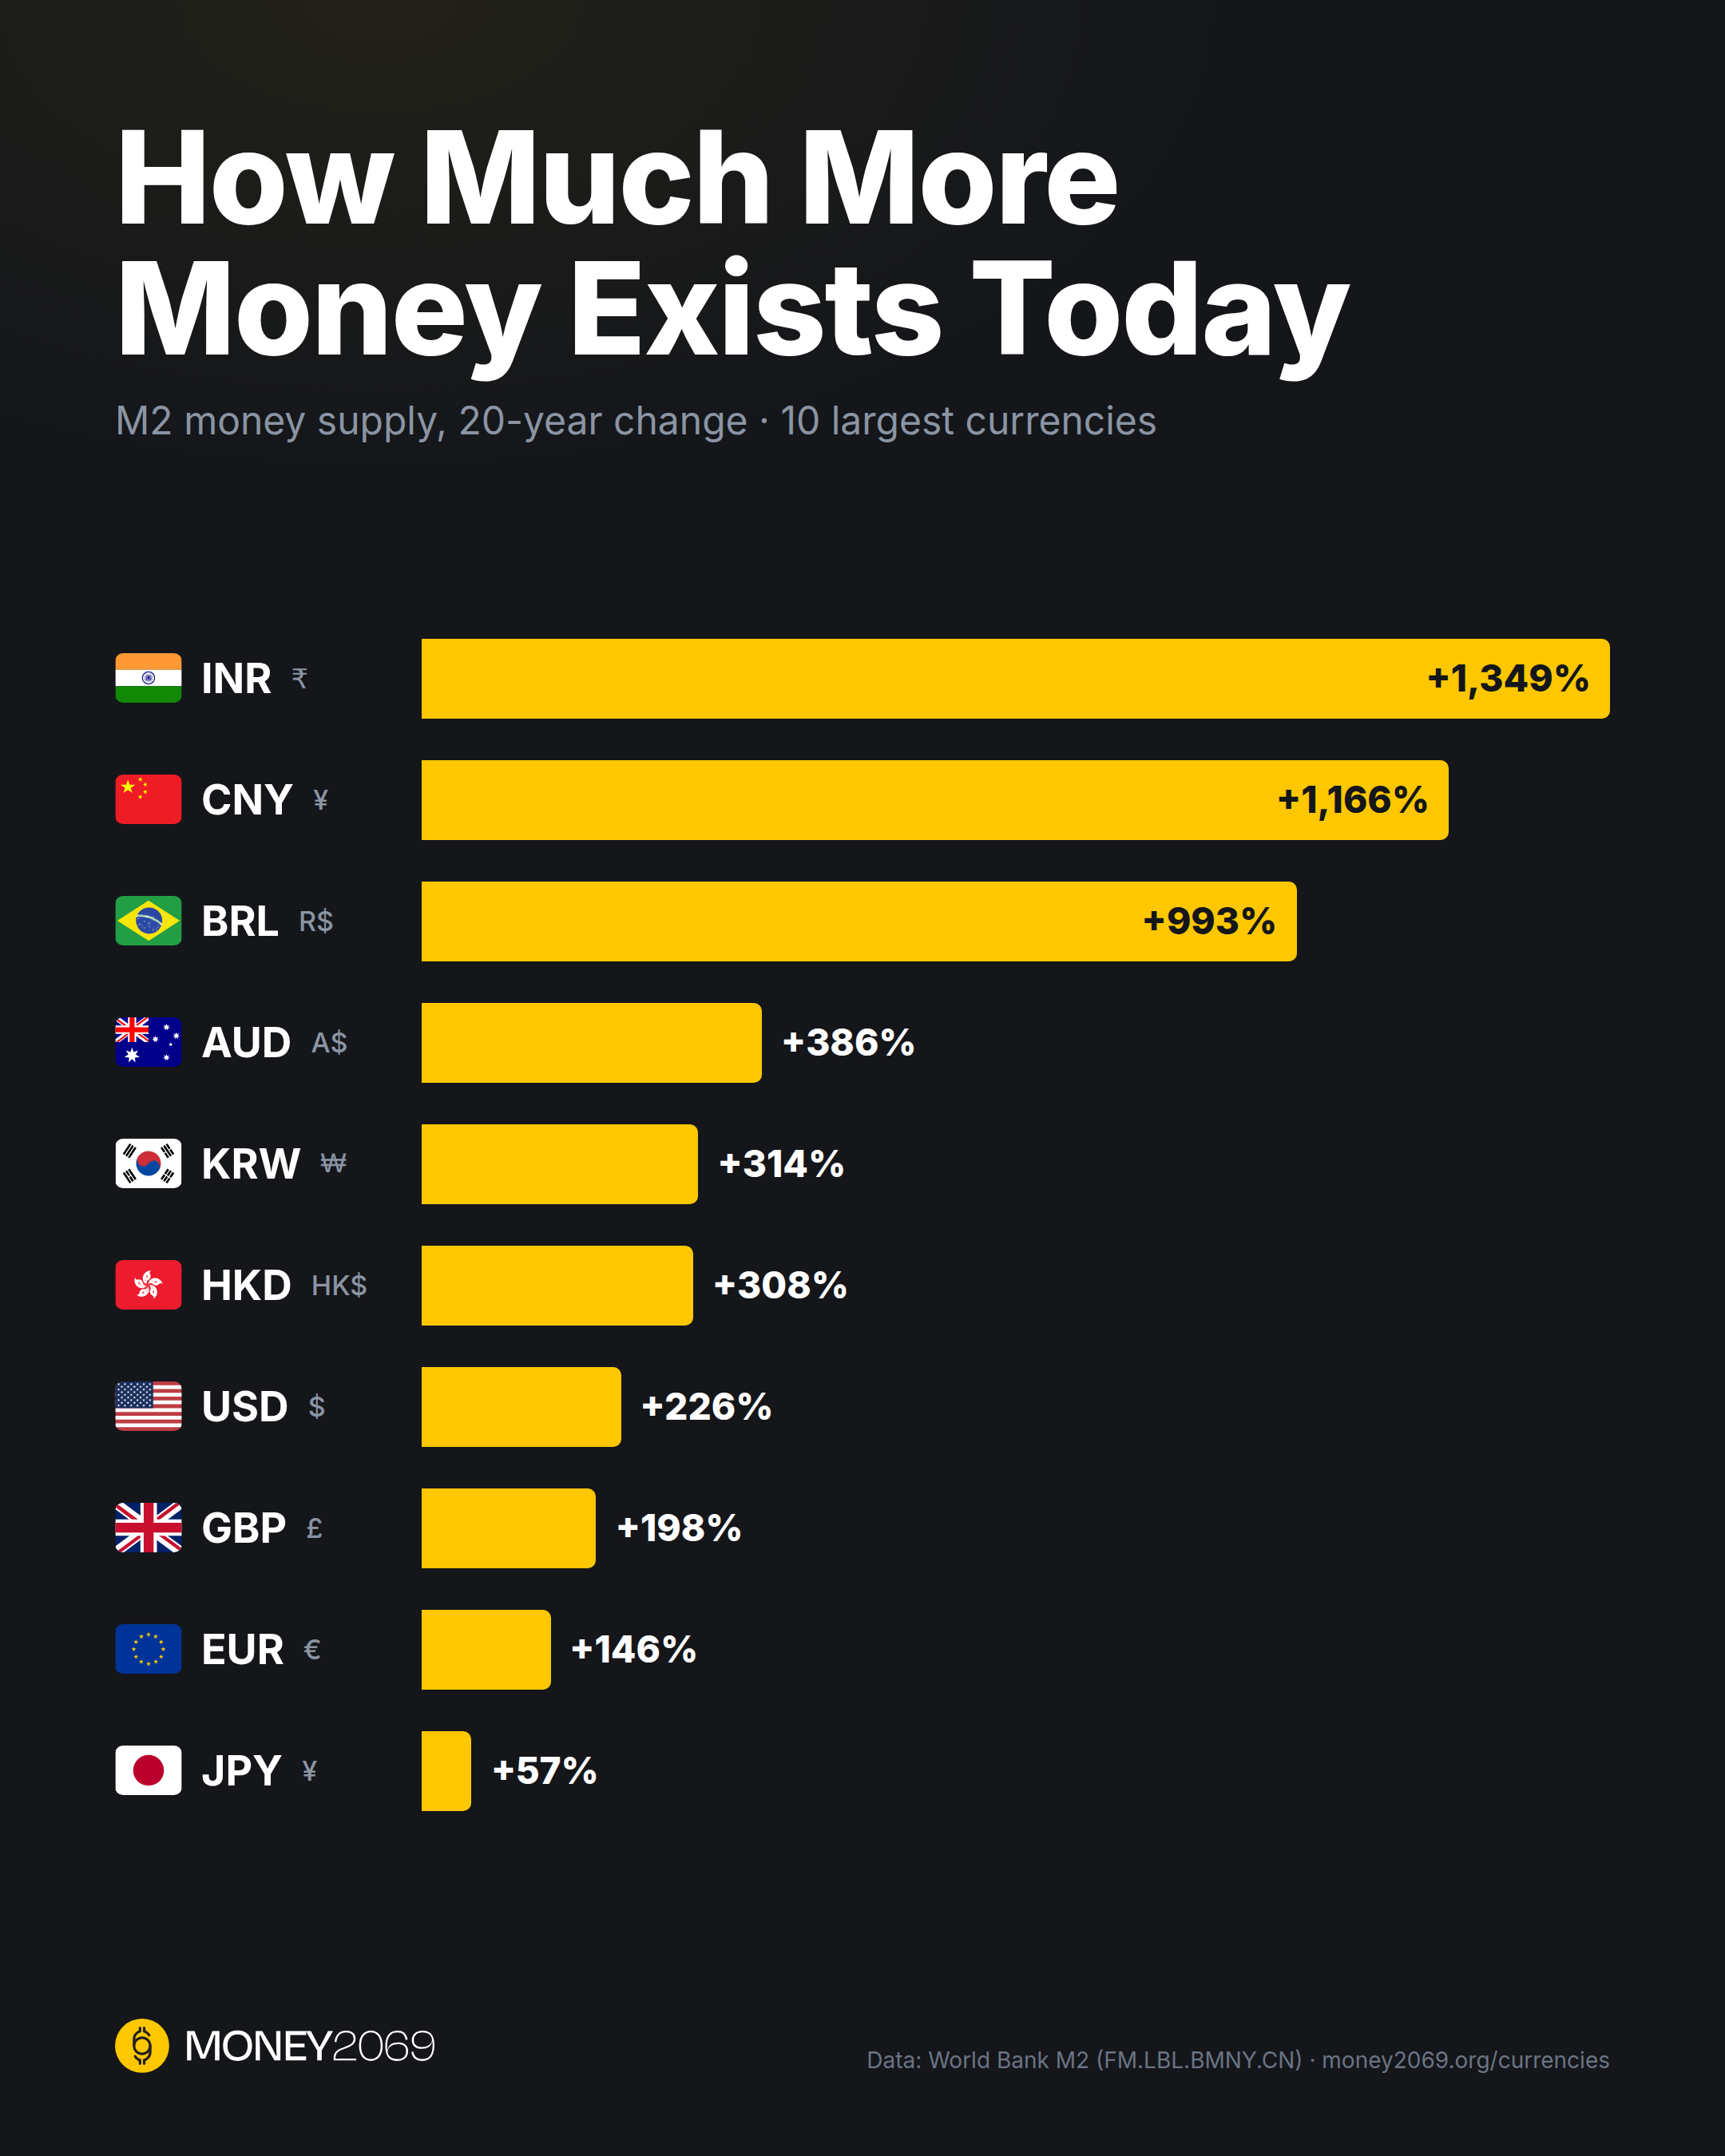
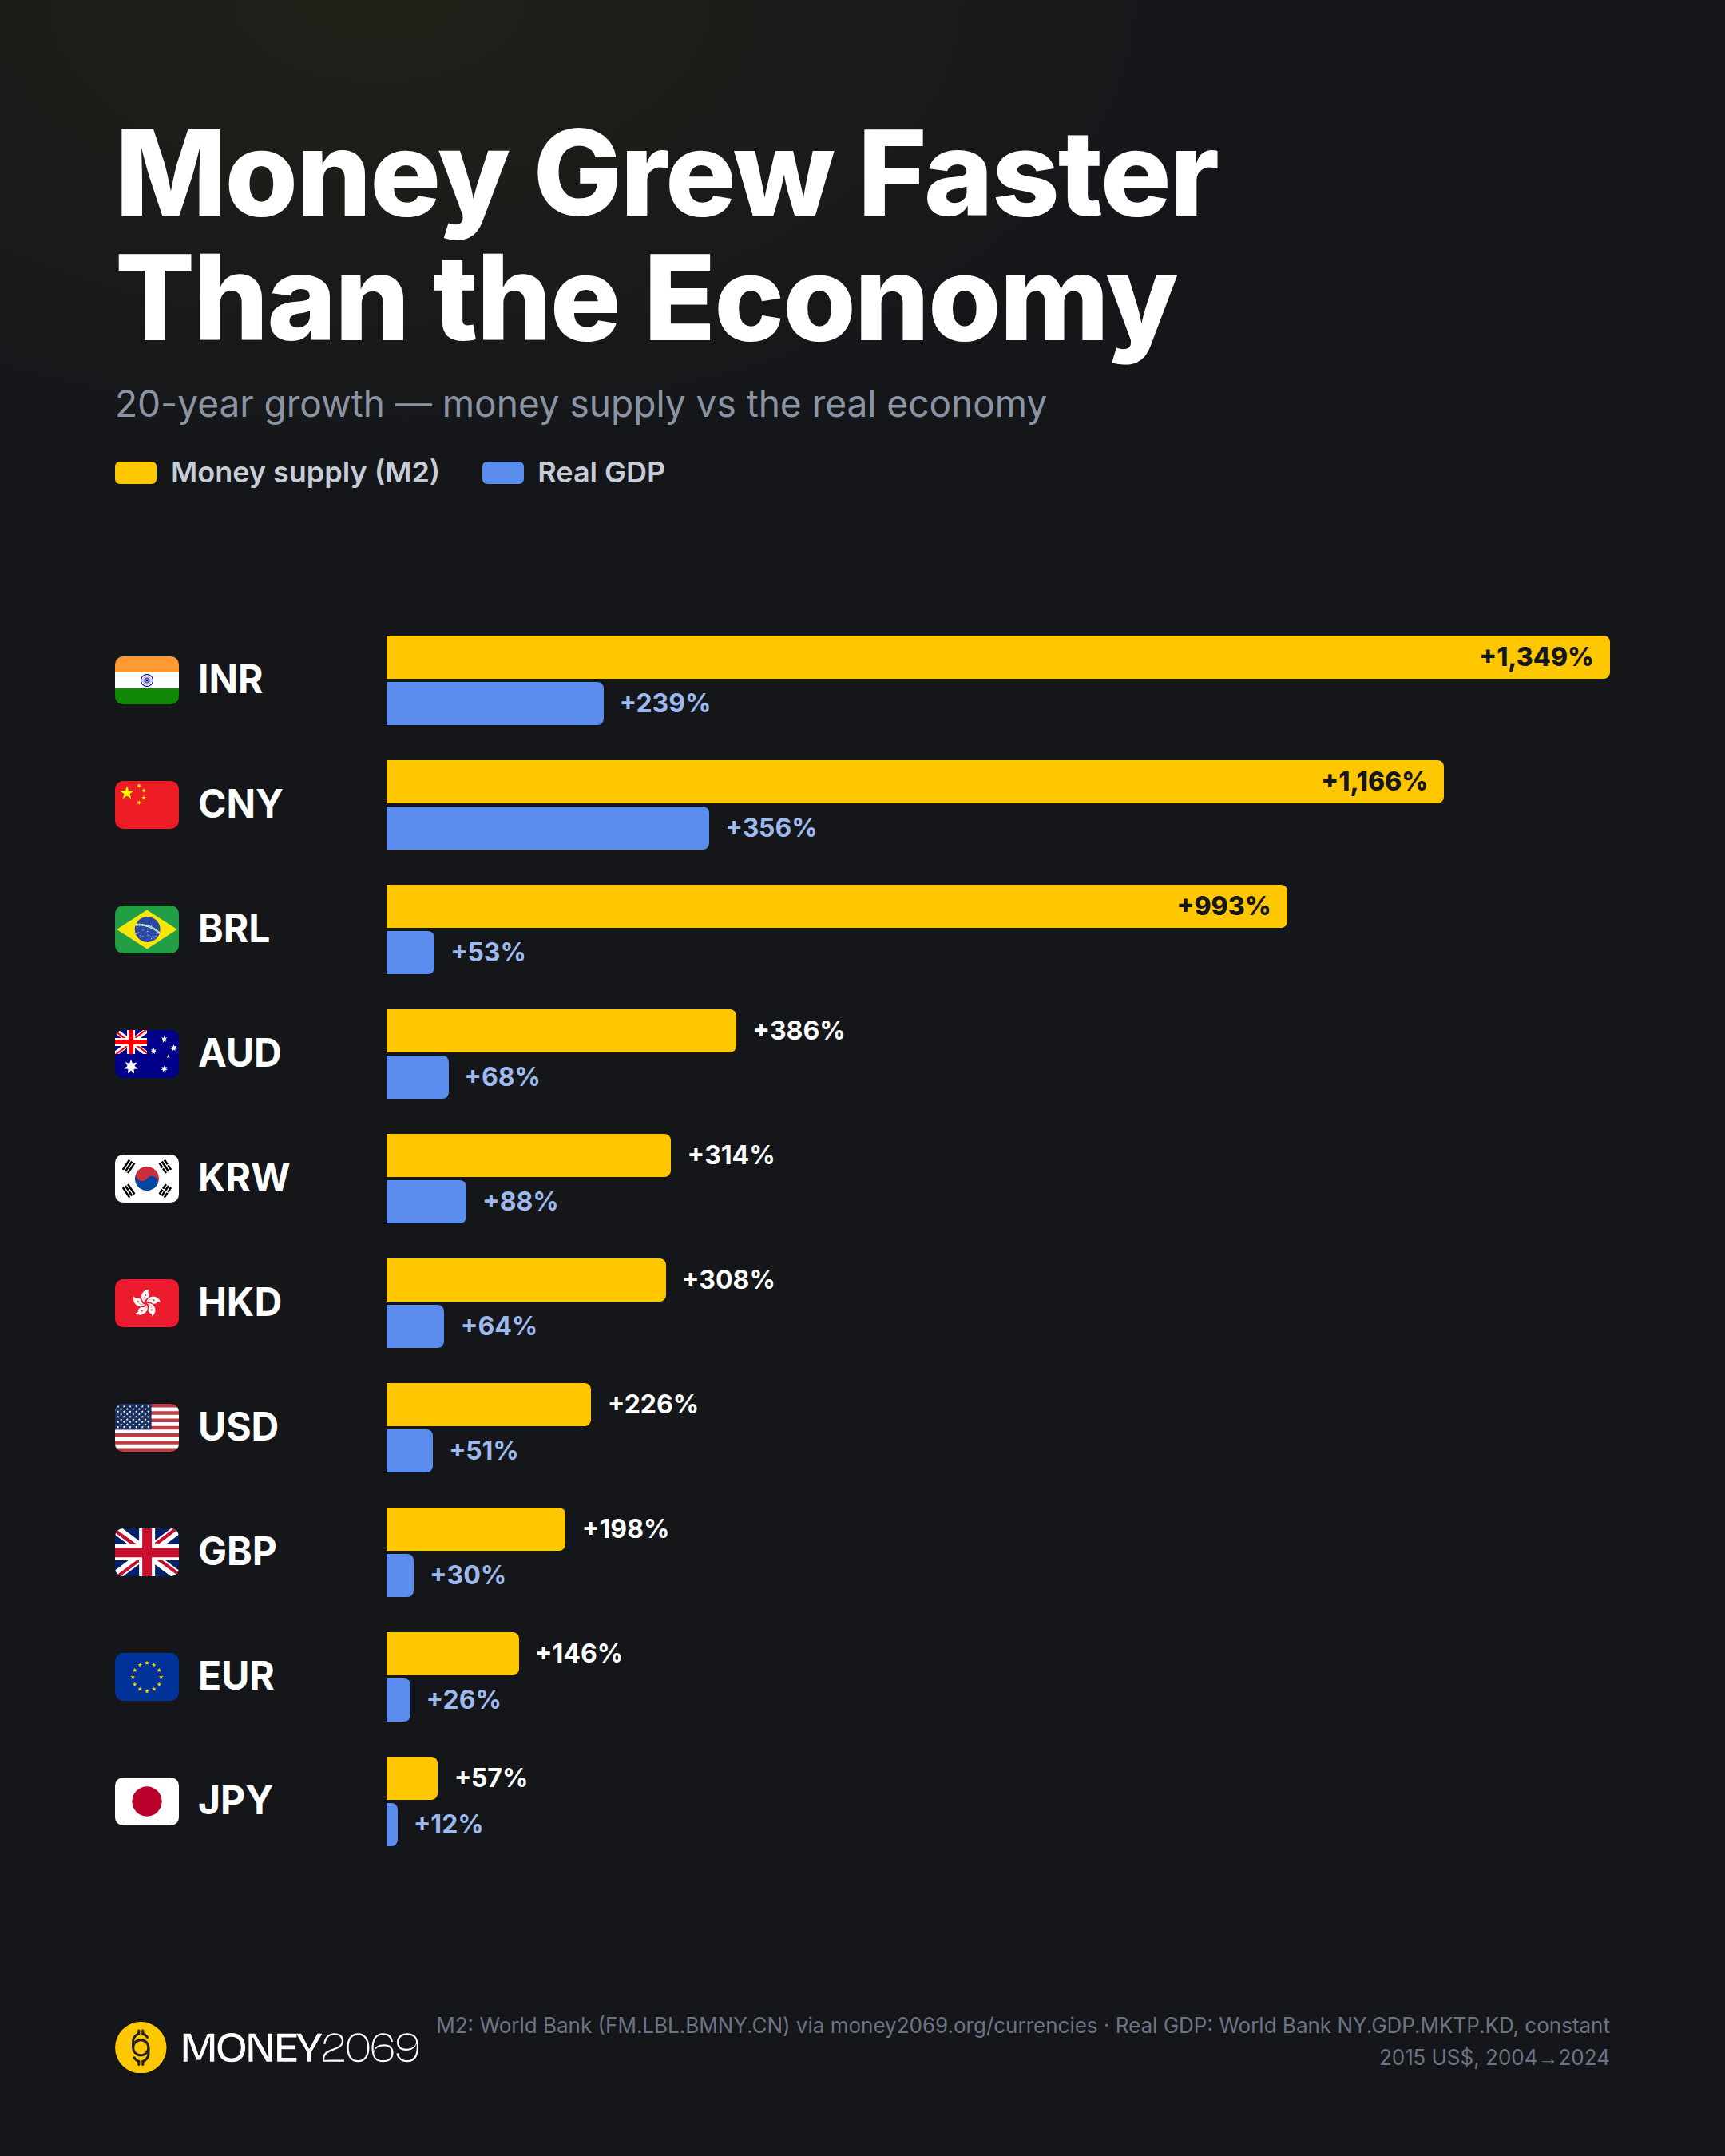
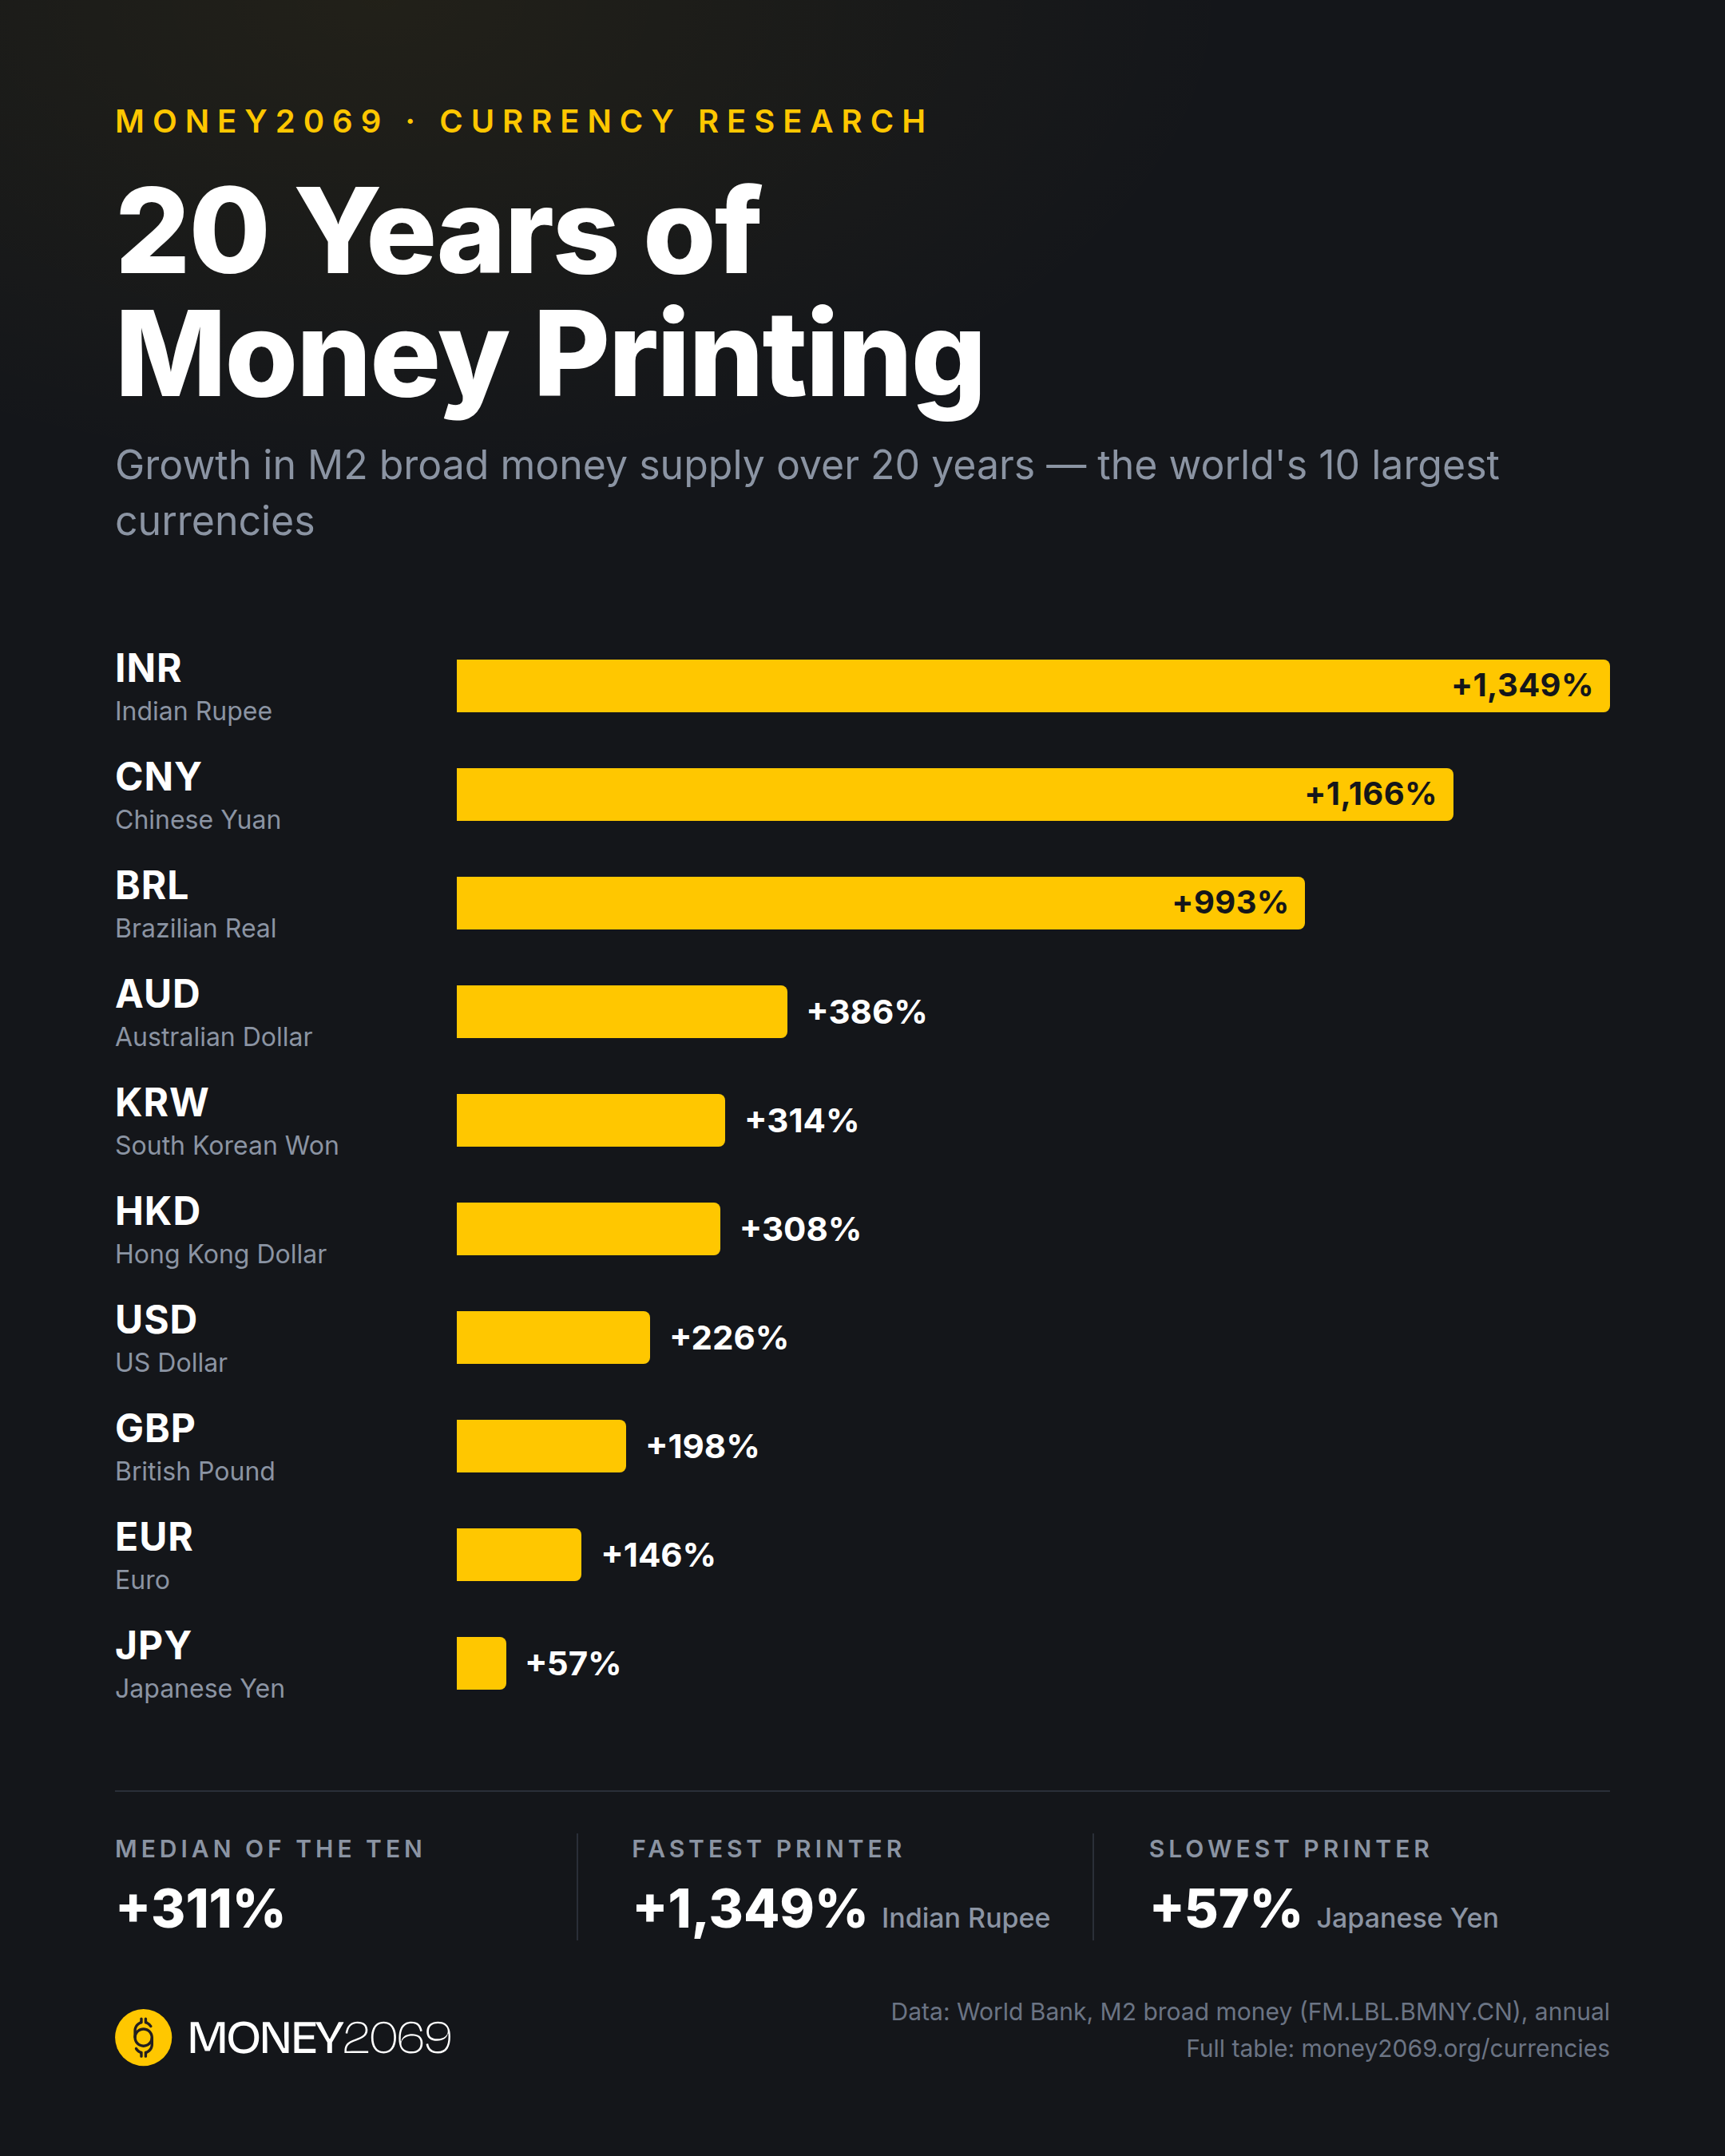
Since 2000, the money supply behind every major currency has ballooned — far faster than the economies they measure.
| # | Currency | Inflation (YoY) | M2 Supply | M2 Growth (20y) | Purchasing Power (20y) | |||
|---|---|---|---|---|---|---|---|---|
| 1 |  US Dollar USDUnited States | 2.9% | $23.1T | +226% | −69% | |||
| 2 |  Euro EUREurozone | 2.5% | €16.4T | +146% | −59% | |||
| 3 |  Japanese Yen JPYJapan | 3.2% | ¥1634.3T | +57% | −36% | |||
| 4 |  British Pound GBPUnited Kingdom | 3.9% | £3.5T | +198% | −66% | |||
| 5 | C Chinese Yuan CNYChina | 0.1% | ¥306.9T | +1166% | −92% | |||
| ★ |  Money2069THE ALTERNATIVEState-free · purchasing-power-stable | Targets 0% | — | Fixed rules | Preserved | |||
Search reaches every currency, including the no-data exotics; sort any column; tap a row for its detail page. No-data rows are labelled, not blank.
Charts & Research
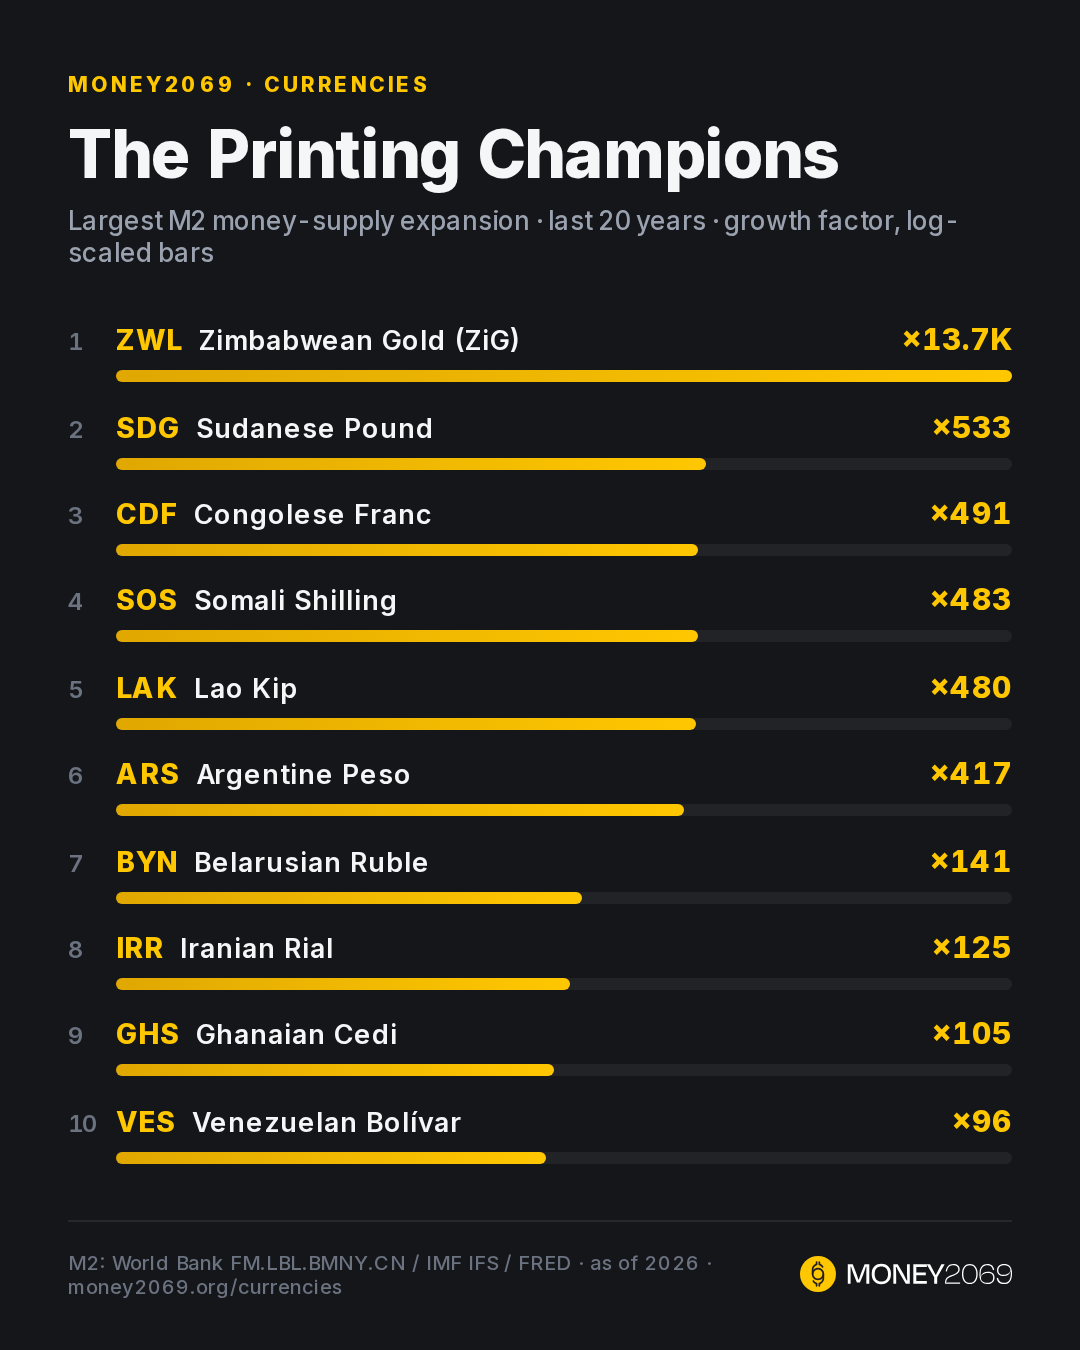
Ready-to-share infographics from the live datasetM2 money supply, indexed to 2001 = 100
Every line goes up — that’s the point. Angle of attack tells the story.
All series matched through 2024; some central-bank sources lag a year or two.
Top 10 reserve currencies, M2 broad money indexed to 2001 = 100. Hyperinflation outliers (ARS, VES, ZWL) are excluded — compare them via log scale on their detail pages. Sources: FRED (M2SL), ECB via DBnomics, IMF IFS via DBnomics, World Bank (FM.LBL.BMNY.CN), OECD via DBnomics · annual series, as of 2026. FX rates by ECB/Frankfurter with Exchange Rate API fallback.





Purchasing-power calculator
Rough estimate from M2 dilution (not CPI) — illustrative. Each currency’s detail page has a CPI-based calculator.