

Japanese Yen
JPYDecades of QE
M2 money supply, indexed to 2001 = 100
Every line goes up — that’s the point. Angle of attack tells the story.
All series matched through 2024; some central-bank sources lag a year or two.
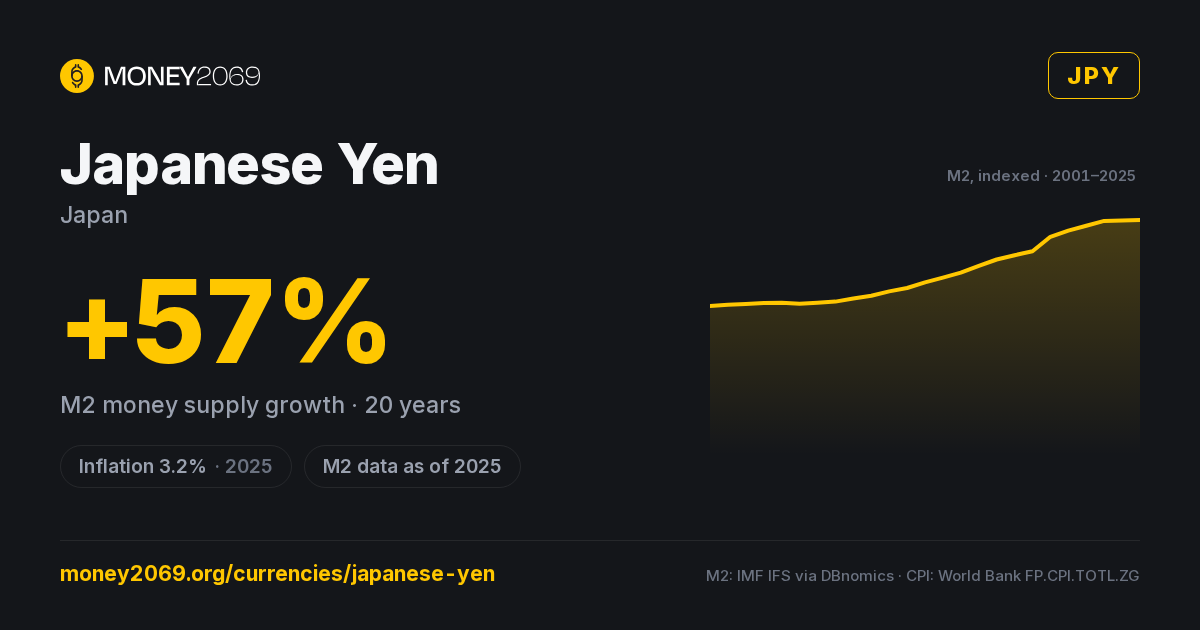
JPY highlighted against the top 10 reserve currencies — M2 broad money, indexed to 2001 = 100. JPY series: IMF IFS via DBnomics, as of 2025.
Japanese Yen M2 money supply
Broad money in JPY (cash + deposits + close substitutes), annual back to ~1960 via World Bank FM.LBL.BMNY.CN. Log scale auto-engages for hyperinflation outliers.
Japanese Yen inflation history
Annual CPI YoY since 1966 — World Bank consumer price index for Japan. Inflation volatility is one of three inputs into the Money2069 sound-money score.

Purchasing power calculator
How much would your Japanese Yen be worth today if you'd held it since…?
Calculation: cumulative product of (1 + CPI YoY) from the chosen year through 2025. Source: World Bank consumer price index (annual). Daily-refreshed.
Data sources & methodology
- FX (USD):
- Frankfurter / ECB · daily, Exchange Rate API fallback
- CPI YoY:
- World Bank FP.CPI.TOTL.ZG · annual
- M2 broad money:
- IMF / central-bank monthly · World Bank annual fallback (LCU)
- Market cap (USD):
- M2 / FX rate · daily
- 10-year M2 change:
- (M2 today / M2 10y ago) − 1
- M69 score:
- Weighted: CPI (50%), 10y M2 growth (40%), 1y FX stability (10%)
- Last fetched:
- 2026-09-13 02:00:00
- Country code (ISO 3166-1):
- JPN
Note: Decades of QE
Raw data: /api/v1/currencies/current/JPY · Rates by Exchange Rate API
The Japanese Yen from a sound-money lens
Decades of QE; a deflation laboratory that finally tipped to inflation in 2022.
The Japanese yen is the world's longest-running monetary experiment in zero-bound policy. The Bank of Japan cut rates to 0% in 1999, ran the first quantitative easing programme (2001), and never meaningfully tightened until 2024. Across that quarter-century, M2 broad money grew from roughly ¥600 trillion to over ¥1,600 trillion — a 2.7x expansion against a flat-to-shrinking population.
For most of that time, yen debasement was invisible because Japan was deflating: CPI averaged near zero or slightly negative through the 2000s and 2010s. The "lost decades" narrative was less about the yen failing and more about it succeeding too well — purchasing power held while wages stagnated.
Then 2022 broke the spell. Imported energy and a yen that fell from ¥110 to over ¥160 per dollar pushed CPI above 4% YoY for the first time since the 1990s. The BOJ's response — tiny rate hikes from −0.1% to 0.25% — was less an end of accommodation than an acknowledgement that the experiment couldn't continue indefinitely.
The yen's story is unique: a currency that printed enormous amounts of money for thirty years without producing inflation, until it suddenly did. For sound-money observers, it's the cautionary tale that monetary expansion always shows up eventually — sometimes via prices, sometimes via the exchange rate, sometimes after a delay long enough that an entire generation forgets what discipline looked like.
Frequently asked questions
Who issues the Japanese Yen?+
What is the inflation rate of the Japanese Yen?+
Has the Japanese Yen been debased?+
Is the Japanese Yen sound money?+
How does the Japanese Yen compare to gold or the US dollar?+
How often is this data updated?+
Compare with
More from Money2069
The Japanese Yen inflates by policy. Money2069 runs on fixed rules — issuance targets 0%, purchasing power preserved by design, no central bank required.
