
US Dollar
USDWorld reserve currency
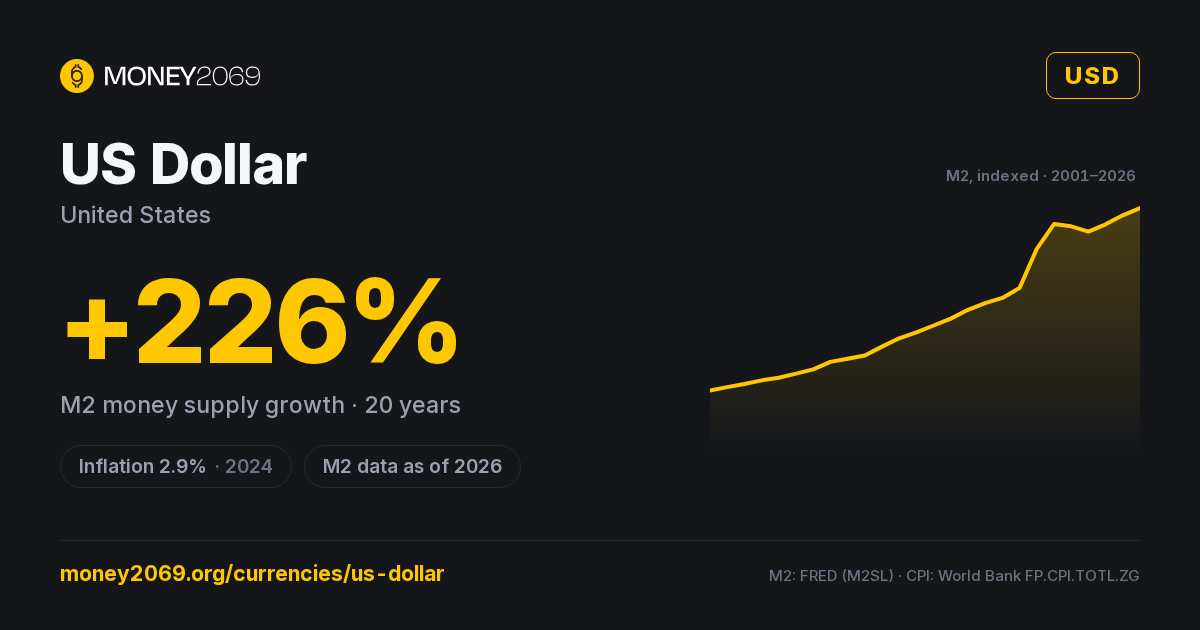
M2 money supply, indexed to 2001 = 100
Every line goes up — that’s the point. Angle of attack tells the story.
All series matched through 2024; some central-bank sources lag a year or two.
USD highlighted against the top 10 reserve currencies — M2 broad money, indexed to 2001 = 100. USD series: FRED (M2SL), as of 2026.
US Dollar M2 money supply
Broad money in USD (cash + deposits + close substitutes), annual back to ~1960 via World Bank FM.LBL.BMNY.CN. Log scale auto-engages for hyperinflation outliers.
US Dollar inflation history
Annual CPI YoY since 1966 — World Bank consumer price index for United States. Inflation volatility is one of three inputs into the Money2069 sound-money score.
Purchasing power calculator
How much would your US Dollar be worth today if you'd held it since…?
Calculation: cumulative product of (1 + CPI YoY) from the chosen year through 2024. Source: World Bank consumer price index (annual). Daily-refreshed.
Data sources & methodology
- FX (USD):
- Frankfurter / ECB · daily, Exchange Rate API fallback
- CPI YoY:
- World Bank FP.CPI.TOTL.ZG · annual
- M2 broad money:
- IMF / central-bank monthly · World Bank annual fallback (LCU)
- Market cap (USD):
- M2 / FX rate · daily
- 10-year M2 change:
- (M2 today / M2 10y ago) − 1
- M69 score:
- Weighted: CPI (50%), 10y M2 growth (40%), 1y FX stability (10%)
- Last fetched:
- 2026-07-24 02:00:00
- Country code (ISO 3166-1):
- USA
Note: World reserve currency
Raw data: /api/v1/currencies/current/USD · Rates by Exchange Rate API
The US Dollar from a sound-money lens
World reserve currency, $28T M2, ~96% lost since 1913.
The US dollar is the closest thing the modern world has to neutral money — every commodity is priced in it, every central bank holds it, every cross-border invoice settles in it. That dominance is also why its trajectory matters more than any other currency on this page.
In 1913, the year the Federal Reserve was founded, a dollar bought what about $32 buys today — a 97% erosion of purchasing power over a century. The pace is uneven: 1913–1971 (the gold-anchored era) lost about half its value; the floating-rate era since 1971 has lost the other half in a third of the time. The 2020 monetary expansion alone pushed M2 from $15.4T to over $20T inside 18 months — the largest peacetime expansion in US history.
Today the M2 broad money supply sits north of $28T. CPI inflation prints near 3% YoY, but the cumulative effect compounds: a dollar saved in 2000 buys roughly 56 cents of goods today. The Federal Reserve's mandate is "stable prices," operationalised as 2% YoY inflation — a target that, by construction, halves purchasing power every 35 years.
The dollar's claim to soundness is institutional, not monetary: the Fed's independence, the depth of US Treasuries, the rule of law, and the absence (so far) of capital controls. None of those guarantee future debasement won't accelerate. The only honest answer to "is the dollar sound money?" is: relative to other fiats, yes. Relative to gold, Bitcoin, or its own 1913 self — no.
Frequently asked questions
Who issues the US Dollar?+
What is the inflation rate of the US Dollar?+
Has the US Dollar been debased?+
Is the US Dollar sound money?+
How does the US Dollar compare to gold or the US dollar?+
How often is this data updated?+
Compare with
More from Money2069
The US Dollar inflates by policy. Money2069 runs on fixed rules — issuance targets 0%, purchasing power preserved by design, no central bank required.