
Indian Rupee
INRCapital controls
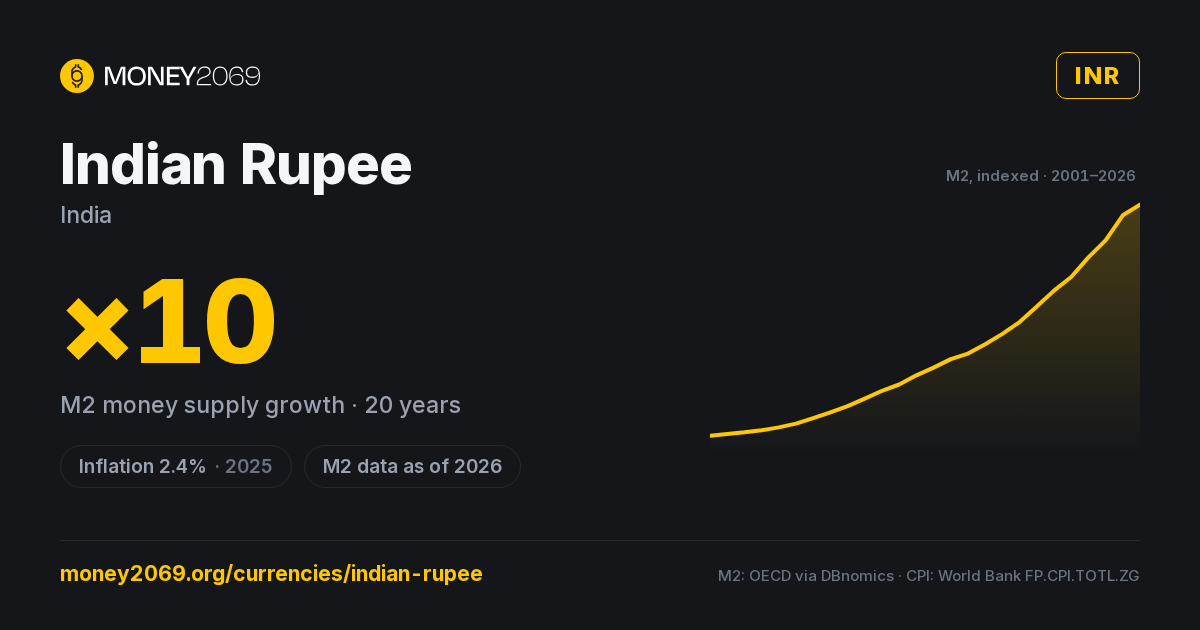
M2 money supply, indexed to 2001 = 100
Every line goes up — that’s the point. Angle of attack tells the story.
All series matched through 2024; some central-bank sources lag a year or two.
INR highlighted against the top 10 reserve currencies — M2 broad money, indexed to 2001 = 100. INR series: OECD via DBnomics, as of 2026.
Indian Rupee M2 money supply
Broad money in INR (cash + deposits + close substitutes), annual back to ~1960 via World Bank FM.LBL.BMNY.CN. Log scale auto-engages for hyperinflation outliers.
Indian Rupee inflation history
Annual CPI YoY since 1966 — World Bank consumer price index for India. Inflation volatility is one of three inputs into the Money2069 sound-money score.
Purchasing power calculator
How much would your Indian Rupee be worth today if you'd held it since…?
Calculation: cumulative product of (1 + CPI YoY) from the chosen year through 2025. Source: World Bank consumer price index (annual). Daily-refreshed.
Data sources & methodology
- FX (USD):
- Frankfurter / ECB · daily, Exchange Rate API fallback
- CPI YoY:
- World Bank FP.CPI.TOTL.ZG · annual
- M2 broad money:
- IMF / central-bank monthly · World Bank annual fallback (LCU)
- Market cap (USD):
- M2 / FX rate · daily
- 10-year M2 change:
- (M2 today / M2 10y ago) − 1
- M69 score:
- Weighted: CPI (50%), 10y M2 growth (40%), 1y FX stability (10%)
- Last fetched:
- 2026-07-24 02:00:11
- Country code (ISO 3166-1):
- IND
Note: Capital controls
Raw data: /api/v1/currencies/current/INR · Rates by Exchange Rate API
The Indian Rupee from a sound-money lens
Managed float, capital controls, 1.4 billion people, RBI walking a tightrope.
The Indian rupee is the largest currency by population — backing 1.4 billion people, more than any other on this page — and one of the most actively managed by its central bank. The Reserve Bank of India operates a managed float with substantial intervention: when the rupee weakens past 84 to the dollar, the RBI sells reserves; when it strengthens too much, it buys.
That management has produced one of the more remarkable charts in this dataset: the rupee has fallen from roughly INR 5 per USD at independence (1947) to over INR 84 today — a 94% decline against the dollar over 75 years. Most of that decline came in two periods: the 1991 balance-of-payments crisis (when India went from a fixed peg to a managed float and devalued ~20% in two days) and the 2010s, when current-account deficits and inflation differentials with the US bled into the exchange rate.
CPI inflation has averaged roughly 6-7% YoY over the past two decades — well above the RBI's 4% target band — driven by food prices, monsoons, and energy imports. M3 broad money has grown roughly 5x since 2010.
India's saving grace is growth: nominal GDP expansion of 7-8% per year for most of the past decade has masked the real cost of sustained inflation. Services exports (IT, BPO) have provided a near-permanent dollar inflow that the rupee otherwise wouldn't generate. Capital controls remain extensive, which both insulates the rupee from speculative attacks and limits its claim to reserve-currency status.
INR 100 in 2000 buys roughly INR 30 of comparable goods today — among the steepest real declines on this list.
Frequently asked questions
Who issues the Indian Rupee?+
What is the inflation rate of the Indian Rupee?+
Has the Indian Rupee been debased?+
Is the Indian Rupee sound money?+
How does the Indian Rupee compare to gold or the US dollar?+
How often is this data updated?+
Compare with
More from Money2069
The Indian Rupee inflates by policy. Money2069 runs on fixed rules — issuance targets 0%, purchasing power preserved by design, no central bank required.