
Australian Dollar
AUDCommodity-linked
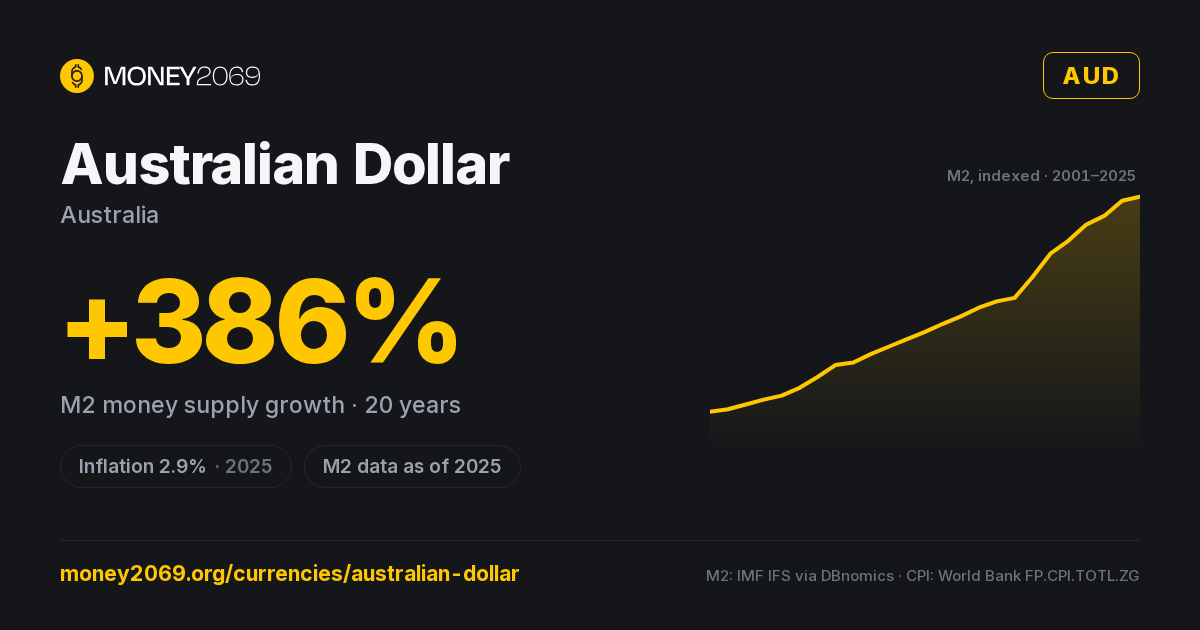
M2 money supply, indexed to 2001 = 100
Every line goes up — that’s the point. Angle of attack tells the story.
All series matched through 2024; some central-bank sources lag a year or two.
AUD highlighted against the top 10 reserve currencies — M2 broad money, indexed to 2001 = 100. AUD series: IMF IFS via DBnomics, as of 2025.
Australian Dollar M2 money supply
Broad money in AUD (cash + deposits + close substitutes), annual back to ~1960 via World Bank FM.LBL.BMNY.CN. Log scale auto-engages for hyperinflation outliers.
Australian Dollar inflation history
Annual CPI YoY since 1966 — World Bank consumer price index for Australia. Inflation volatility is one of three inputs into the Money2069 sound-money score.
Purchasing power calculator
How much would your Australian Dollar be worth today if you'd held it since…?
Calculation: cumulative product of (1 + CPI YoY) from the chosen year through 2025. Source: World Bank consumer price index (annual). Daily-refreshed.
Data sources & methodology
- FX (USD):
- Frankfurter / ECB · daily, Exchange Rate API fallback
- CPI YoY:
- World Bank FP.CPI.TOTL.ZG · annual
- M2 broad money:
- IMF / central-bank monthly · World Bank annual fallback (LCU)
- Market cap (USD):
- M2 / FX rate · daily
- 10-year M2 change:
- (M2 today / M2 10y ago) − 1
- M69 score:
- Weighted: CPI (50%), 10y M2 growth (40%), 1y FX stability (10%)
- Last fetched:
- 2026-07-24 20:43:43
- Country code (ISO 3166-1):
- AUS
Note: Commodity-linked
Raw data: /api/v1/currencies/current/AUD · Rates by Exchange Rate API
The Australian Dollar from a sound-money lens
The other commodity dollar — China's iron ore proxy.
The Australian dollar is, more than any other major currency, a real-time bet on Chinese industrial demand. Iron ore alone accounts for roughly a quarter of Australian exports, with coal, LNG, and agricultural goods adding another third. When Chinese steel production rises, AUD rallies; when Beijing tightens, AUD softens.
The Reserve Bank of Australia targets 2-3% YoY inflation — slightly above the Fed and ECB — and has historically run policy a touch looser than peer central banks. Cash rate hit 0.10% in 2020 (its lowest ever), then climbed to 4.35% by late 2023 to combat post-pandemic inflation. M3 broad money roughly doubled between 2010 and 2024.
CPI peaked at 7.8% YoY in late 2022 — Australia's worst inflation in 32 years — driven by fuel, housing, and supply chain bottlenecks. By 2024 it had eased back below 4%, helped by an aggressive rate path and a cooling labour market.
The AUD's structural weakness, from a sound-money perspective, is its housing market. Roughly 65% of household wealth is locked in residential real estate, mortgages drove household debt to 200% of disposable income, and Australian banks have the most concentrated property exposure of any major banking system. That concentration is fine until the day commodity revenues fall — at which point the AUD takes the strain because the housing market structurally cannot.
Cumulative purchasing power loss since 2000: roughly 40%, or AUD 100 then = AUD 60 today.
Frequently asked questions
Who issues the Australian Dollar?+
What is the inflation rate of the Australian Dollar?+
Has the Australian Dollar been debased?+
Is the Australian Dollar sound money?+
How does the Australian Dollar compare to gold or the US dollar?+
How often is this data updated?+
Compare with
More from Money2069
The Australian Dollar inflates by policy. Money2069 runs on fixed rules — issuance targets 0%, purchasing power preserved by design, no central bank required.